Misinformation Escape Room DRG (Quantitative Analysis)
- Team (Alphabetical order): Gina Rome, Lei Lei, Sathvika Shakhamuri
- Duration: about two months (3/29 – 6/1)
- Data: 64 participants survey data (who conducted the survey after playing Escape room game)
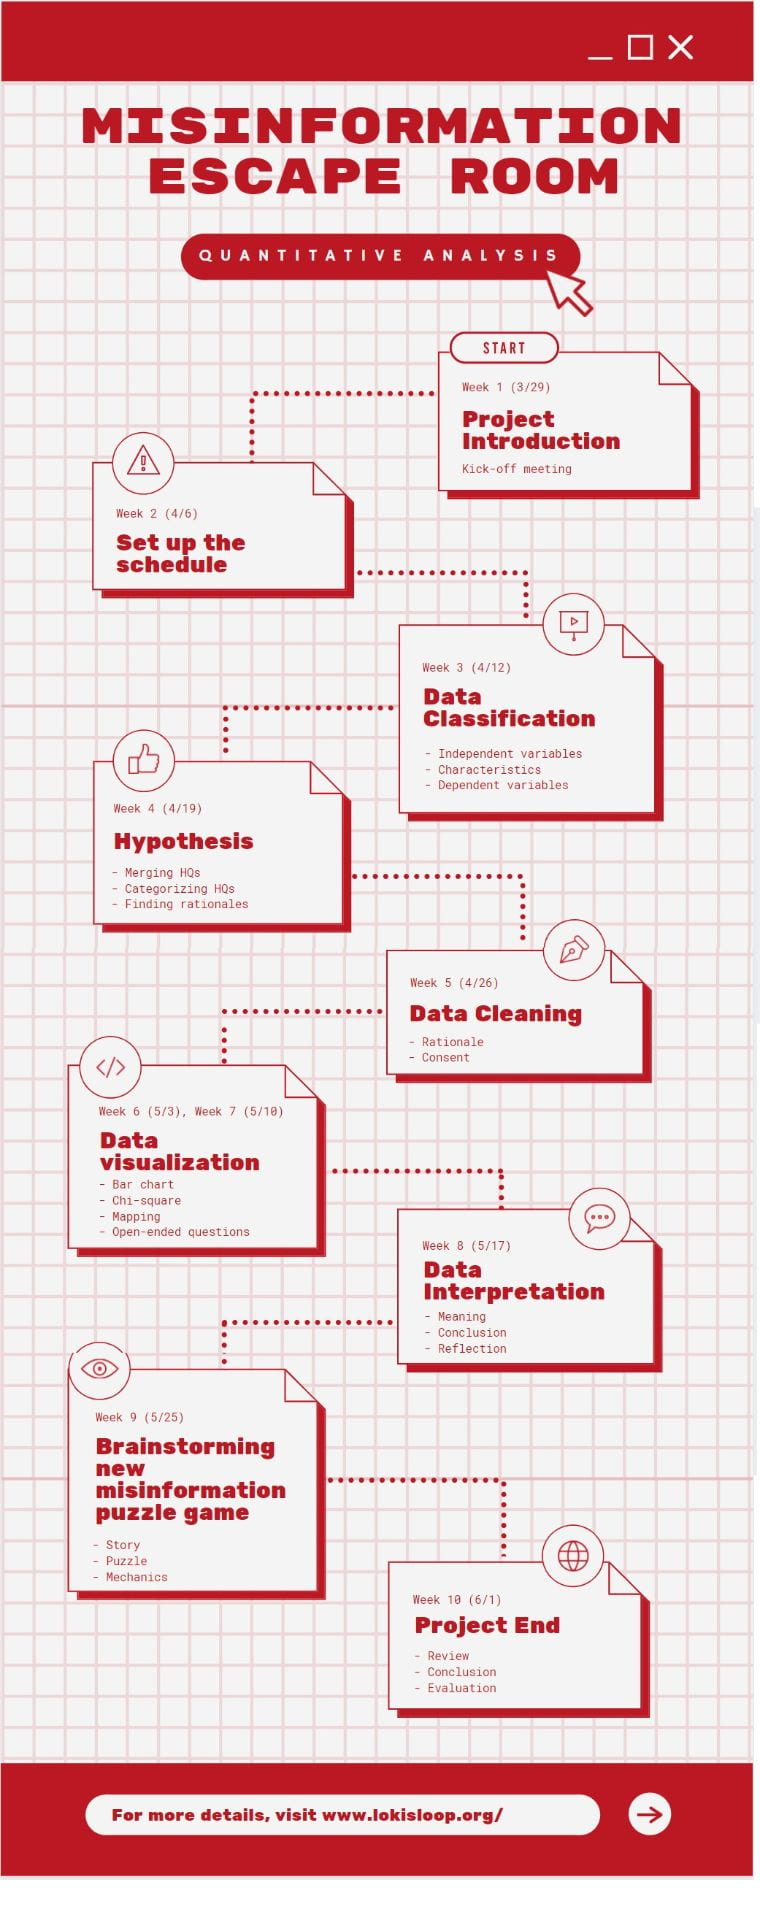
Week 1 & 2: Project Introduction
Week 3: Data Classification
We divided questions in three categories: Independent variables (Demographics or Characteristics) and dependent variables.

Week 4: Hypothesis
After sorting the data, we conducted the initial data analysis to find the meaningful data.
After discussion, we wrote down all the possible hypotheses aligning with rationale, examples.
Week 5: Data Cleaning
Before conducting real data analysis, we had a session to discuss data cleaning: where to remove and remain the data.
Week 6 & Week 7: Data Visualization
We started to visual the data by using R and Python software. First of all, we did hand-writing sketch and convert the sketch to digital version, We commonly used bar graphs and chi-square to measure validity.
Week 8: Data Interpretation
Based on the bar graphs and chi-square, we concluded meaning of the data and reflection.
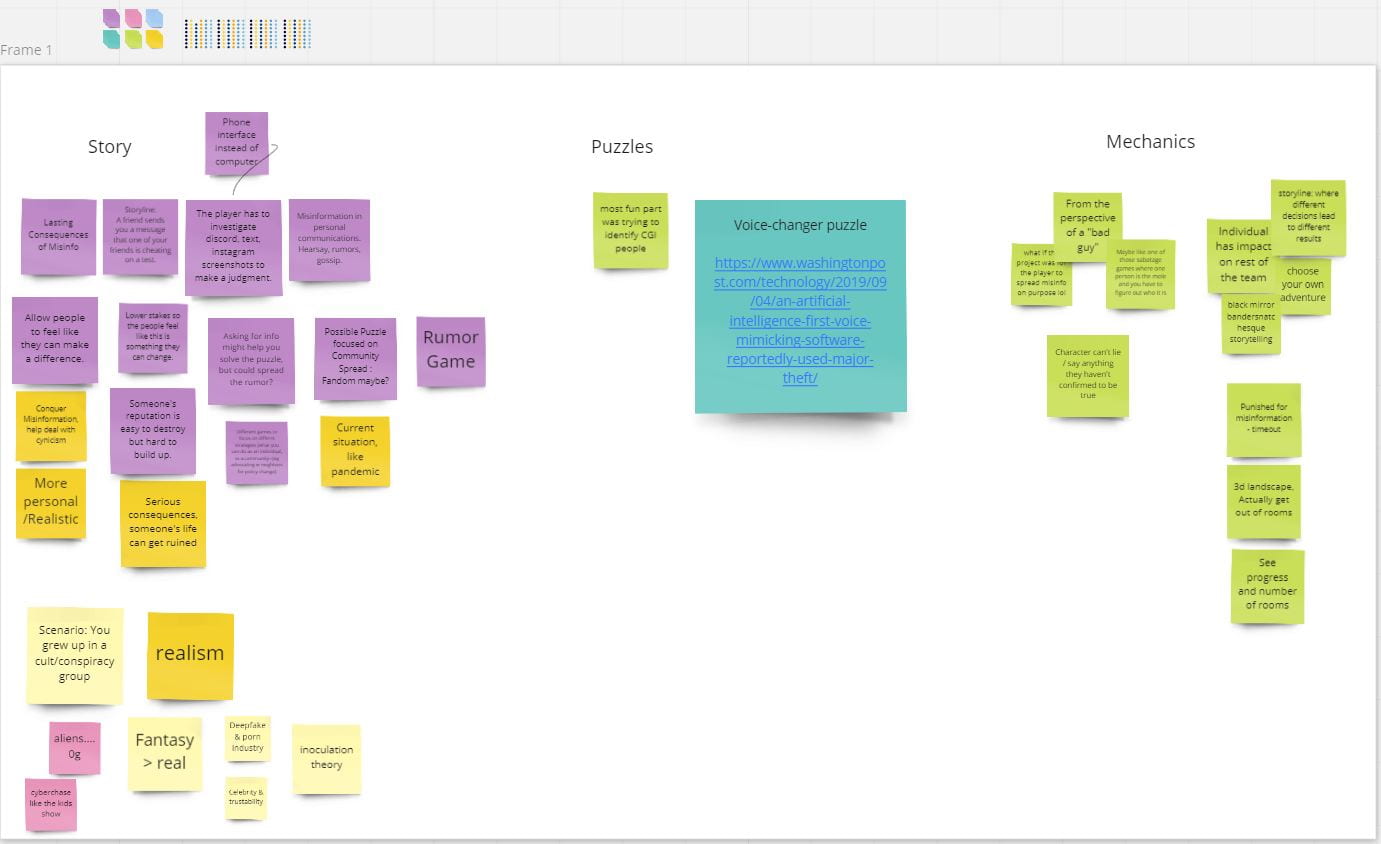
Week 9: Brainstorming new Puzzle game idea
This was the brainstorming activity with qualitative team. Based on the data, we think about what kind of misinformation puzzle games we can make in the future based on the data.
Week 10: Project End
Thank you for your contribution!
— Misinformation Escape room Research Team
https://docs.google.com/document/d/17UBN6ntjc1TMNQghSjfOIjK-m-W_0KVwKwcSMirEuo8/edit


